
One of the less heralded but more puzzling moves the Eagles made this offseason was letting punter Sav Rocca walk in free agency. By almost every conventional metric, Rocca had perhaps his finest season.
At age 37, in his fourth year in the NFL, Rocca had the highest punting average, the fewest touchbacks, and the most punts landing inside the 20 of his career. Yet, despite his performance, the Aussie was allowed to take his talents down to Washington, and the Eagles picked up undrafted rookie Chas Henry out of Florida.
Perhaps the move wasn't so much about Rocca as it was about Bobby April starting fresh with young specialists who he can coach up. Still, the move was at least a minor head-scratcher, considering the veteran's career year in 2010.
So, naturally, I began to wonder if Rocca's season was actually as good as we thought. Basic punting statistics are particularly unreliable because they rely heavily on the situation. When a punter is backed up in his own territory, he gets to stretch his leg as far as he can, achieving distance above everything else. However, if a player has more punts from near midfield, he will have to kick for more accuracy and less power. The net punting average will depend heavily on this distribution of situational punts.
Derek Sarley of Iggles Blog tackled this problem last off-season. He compiled the play by play data and came up with a situational-based "optimal" punting scale. It works like so:
Yline = Line of scrimmage for the punting team. Number 1 to 99 (theoretically) from their own goal line.
Punt = Punt distance
Return = Return distance
Result = Yline PLUS Punt MINUS Return
Optimal Result = "IF (Yline < 40 , Yline PLUS 50 , 90)." In English, if the line of scrimmage was between the 1 and 39 yard lines, I made the optimal result a 50-yard net punt. If it was on the 40-yard line or beyond, I called the optimal result a change of possesion on the 10-yard line. There are opportunities for further refinement here, but as you'll see in a minute, it won't matter that much once we start comparing apples to apples.
Difference = Actual result MINUS Optimal result.
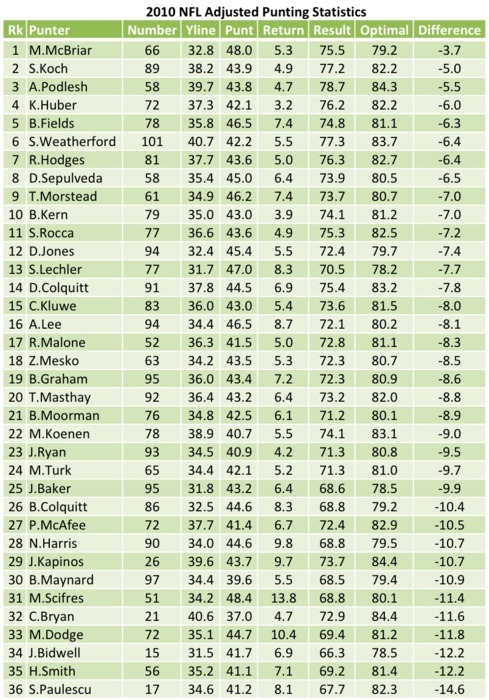
Obviously, "Optimal" doesn't necessarily mean perfect. But it works to show about the Top 10 percent or so of all punts, accounting for field position. All punters average results below the optimal point, but the better punter they are, the closer they come. You can see the full results of the Top 36 punters in the NFL in 2010 (compiled and tabulated painstakingly from play by play data) by clicking on the thumbnail picture at right.
Sports
In partnership with NBC Sports Philadelphia


Note that ranking the punters by difference from optimal sometimes confirms preconceived notions of greatness, and sometimes it debunks them. This statistic shows that Dallas's Matt McBriar, for instance, deserved his Pro Bowl nod. Oakland's Shane Lechler, on the other hand, seems less impressive when you normalize the punting situations.
Overall, Rocca was ranked 11th in the league last year, good enough for the top third. However, we can dig a little bit deeper by comparing Rocca's stats to those of the average punter at each point on the field. See the chart below with splits from line 1-20, 21-40, and 41-plus (small sample size warnings for Rocca's numbers apply):
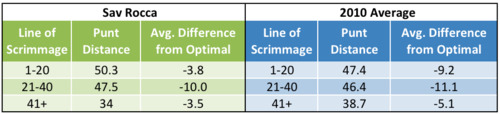
As you can see from the "Difference" column, Rocca's punts had better results than the average at every point on the field. He wasn't an elite punter, by any means, but there wasn't much cause to let him go either. In other words, he was in about the same place as David Akers: above average but not substantially so.
This supports my theory that clearing out special teams was as much about setting a new tone and bringing in players April could teach as actually improving the results. Still, I'm interested in any other theories or lessons you can take away from this data.