
WHO SAYS? 60 COUNTRIES & NEARLY 500 SCIENTISTS
When you put dozens of countries and hundreds of scientists together, the resulting report is likely to be a rather conservative one. Any scientists who argue for stronger language have to be mixed in with those extra careful or skeptical ones. If the average of all of that is still extreme, then I’d say we have a problem.
We have a problem.
But who can argue with statistics? Plenty of people, as it turns out. But it is getting harder and harder for them to be taken seriously. As evidence, I present you with some of the conclusions of this yearly massive study from NOAA’s National Centers for Environmental Information, published by the American Meteorological Society. Here is the full report, in case you want to read it.
HOTTEST-THE LAND
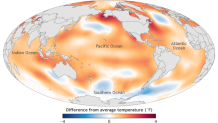
It wasn’t a surprise, but 2016 was the warmest year on earth in 137 years of record keeping. The year it beat? Last year. Combining long-term warming with a strong El Nino for part of the year did the trick.
[[439769763, C]]
Local
Breaking news and the stories that matter to your neighborhood.


That’s warm just about everywhere. The 2016 warmth is compared to the average from 1981-2010, which is the correct way to look at temperature trends. If scientists really wanted to show a lot of brown colors, they would have used an earlier period, such as 1951-1980. But that is not how we do it in the weather world.
HOTTEST-THE OCEANS
It’s not just the land that is heating up. The oceans, on average, have warmed the most along the U.S. East and West coasts, which is nice if you want to go for a swim. But it’s not nice if a hurricane is tracking northward from the Bahamas. A warmer ocean means it won’t weaken as fast as in the “good old days”, when the cooler ocean protected us better.
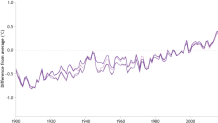
The ocean temperatures have been going up steadily for at least the past 100 years, and, unfortunately, it’s been going up even faster this century than the longer term average (+2.92 degrees F vs. +1.8 from 1950-2016). That is 62% faster!
Warmer oceans also lead to more moisture, which can help make big storms bigger. That means more downpours in the warm seasons (so heavy rain records are no accident, and we can expect even heavier rains in the future).
HIGHEST-SEA LEVEL RISE
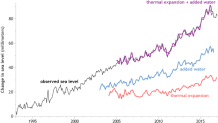
Sea level rises due to a combination of factors. First, warmer water expands. It’s called “thermal expansion” and it is basic physics. And second, that melting ice over land in places like Greenland adds to the sea level, too (the melting ice in the Arctic does not). The year 2016 was the 6th in a row that set a record for sea level.
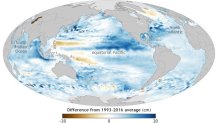
There is a lot of dark blue along and off the East Coast of the U.S. The added sea level sure doesn’t help us when we get a coastal flood threat. It won’t be too long before the National Weather Service will have Coastal Flood Advisories every time there’s a normal high tide. See my recent blog on how sea level rise affects our area”
[[432747473, C]]
The “State of the Climate” report includes a great graphic that shows the impact of both thermal expansion and ice melt over land:
MORE EXTREMES IN MOISTURE
We’ve already discussed how warmer oceans are associated with heavier rainfall. But when the land warms, the opposite tends to happen. Higher temperatures=more evaporation, which leads to even higher temperatures, and then more evaporation, etc. If you get enough evaporation, you’ve got a drought. And the world had more than a few in 2016.

There is a lot of blue (very wet) and brown (very dry) on the above map. There are other reasons for some of these extremes, such as blocking patterns in the atmosphere and poor land use. But it’s getting to the point that it’s “abnormal to be normal” in the moisture department.
THE CONTROVERSY
There really isn’t much controversy about any of the above information or graphics. Other issues are indeed being debated among climate scientists, such as the impact of climate change on severe storms, hurricanes, snowstorms, and wildfires. But we’re able to measure things like temperatures, rainfall, ice melt, and sea level. It’s not as exact a science as plotting the total solar eclipse, but it’s getting there.