What to Know
- How much snow are we in for? How cold will it be during the winter?
- NBC10 First Alert Weather meteorologist Glenn "Hurricane" Schwartz has his 22nd annual Long-Range Winter Forecast.
- There are many factors that go into the winter forecast.
Let’s cut to the chase. We’re in for a cold and snowy winter. But how much snow? And how low will the temperatures go? I measure several important factors to reach that conclusion.
It started in 1997 with a look at something I’d only seen a couple of times before. A huge area in the Tropical Pacific, bigger than the size of the United States, was getting MUCH warmer than normal. They called it an “El Nino.” I had just read research showing the potential connection between strong El Ninos and warm, wet, and un-snowy winters in the eastern U.S.
So, I went on the air and predicted an unseasonably warm winter with very little snow. We had a record warm winter and our TOTAL snow was less than an inch. That got some attention. Now, a winter forecast is expected every year in November.
Few winter forecasts are as straightforward as the one in 1997. Major El Ninos can still be counted on to give us warm winters with little snow. But most years aren’t like that.
“IT’S JUST LIKE..."
Local
Breaking news and the stories that matter to your neighborhood.


We’ve learned there are a lot more factors in the ocean and atmosphere that can help us with seasonal forecasting. We also know that no two winters are alike. There is always one part of the ocean that is different. So there’s no such thing as a perfect “analog” year. But some do have a lot of similarities.
Whether we have an El Nino or the opposite, La Nina, often makes a big difference. But it’s not as clear-cut when it is on the weak or moderate side (as in most years).
FACTORS
1. EL NINO
It’s not just about El Nino vs. La Nina anymore. WHERE the El Nino is most concentrated is important, too. Most El Ninos cover much of the Tropical Pacific. Less frequently, the Central Tropical Pacific has the most concentrated warmth. It’s called a “Modoki.”
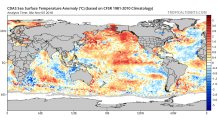
While many El Ninos lead to warmer winters, Modoki Ninos tend to be colder and snowier, especially if it is in the weak or moderate category.
This winter: Weak to moderate MODOKI El Nino...
FAVORS COLDER AND SNOWIER THAN NORMAL
2. NORTH PACIFIC “BLOB”
We’ve seen it several times this decade. A large area of way-above-normal ocean temperatures in the North Pacific Ocean. This leads to more HIGH pressure developing around Alaska and Northwest Canada, which forces the Arctic air down into the Eastern U.S.
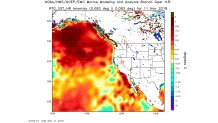
Those red colors at the top, just off Alaska and western Canada, show the current “Blob.” That’s an important factor in what our winter will look like.
This winter FAVORS MORE ARCTIC INVASIONS
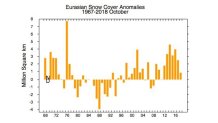
3. EURASIAN SNOW IN OCTOBER
It’s more of an indirect effect, but a quick advance of snow in October halfway around the world is connected with winter cold and snow in the Eastern U.S.
This year, the Eurasia snow cover started very slowly but advanced rapidly toward the end of the month. My research shows that combination as the most favorable one for winter snow for us.
So, this winter FAVORS MORE SNOW
4. THE QBO
The “Quasi-Biennial Oscillation” occurs way up in the stratosphere, and it tends to shift direction every few years. During the transition periods, blocking patterns in the upper atmosphere occur more often. Blocking patterns, especially in El Nino years, favor more (and stronger) Nor’easters. If it happens to be cold enough, that means snow.
The QBO index tends to have a steady trend, and it is trending toward the transition period.
This winter FAVORS MORE SNOW
5. SOLAR ACTIVITY
This is a bit controversial among meteorologists, but there seems to be a correlation between especially low sunspot activity on the sun and colder and snowier winters in the U.S.
The graphic below shows the clear sunspot cycle in recent decades. Some of our cruelest winters have occurred near the bottom of the cycle, when there are hardly any sunspots. We happen to be right near the bottom this year.
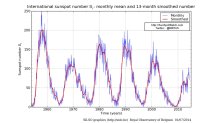
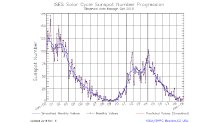
This winter FAVORS MORE COLD AND SNOW
6. THE AO, & NAO
What is going on in the Arctic and North Atlantic can be just as important as the Pacific. But things like the Arctic Oscillation and the North Atlantic Oscillation have been just about impossible to predict months in advance (unlike El Nino, QBO, and “The Blob”). So, they are always considered a “wild card.”
A negative AO means unusually HIGH pressure at high levels over the Arctic. This forces the coldest air south into Canada and the U.S. And it forces the Polar Jet Stream farther south than normal. The record winter of 2013-14 featured several giant snowstorms with a strongly negative AO.
When the NAO is negative, HIGH pressure is centered near Greenland. This pattern favors slower-moving coastal storms in the Eastern U.S. A negative NAO is often one of the ingredients in our biggest Nor’easter snowstorms.
The Eurasia snow connection mentioned earlier may be connected to –AO. So maybe it can be predicted.
7. MELTING ARCTIC ICE & CLIMATE CHANGE
It has become more and more obvious to many forecasters and climate scientists that the massive Arctic ice melt is influencing weather patterns. One of the impacts is in more blocking patterns, including the –AO and –NAO.
It is probably not a coincidence that 3 of the 4 biggest snowstorms in Philadelphia occurred in the past decade or so (2009, 2010, and 2016). The combination of more blocking and more water vapor due to the warming climate is a recipe for big snowstorms — IF it’s cold enough. And a –AO can help with that. These recent changes need to be considered when making seasonal forecasts.
8. SEASONAL COMPUTER MODEL FORECASTS
Until recently, specific computer model forecasts were not considered useful by most forecasters. But as our knowledge of the atmosphere and models improve, so have the forecasts. Now, I actually care what they show (of course, the U.S. model, the GFS is the least trusted in this area). The European and UKMET models have just recently predicted patterns that favor cold and snow for us. And so have the Canadian and Japanese models. That’s a lot of agreement.
This winter FAVORS MORE COLD & SNOW
THE FORECAST (FINALLY!)
So, you see, virtually EVERY important factor that I look at tilts toward more cold and snow this winter. The only questions in my mind are: “Just how cold & snowy do I go?”
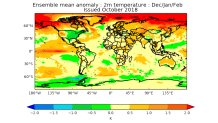
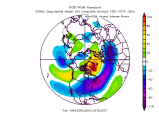
The answer lies in looking at past years with somewhat similar conditions-called analogs. The analogs for this year show a dramatic pattern, especially for February.
The first map is average February about 20,000 feet up in the atmosphere — a key level for forecasters. The lower pressures in the Northeast U.S. are extreme for a map like this. And the very high pressures over Greenland suggest a strong –NAO. That combination SCREAMS East Coast Snowstorms!

And the above map showing February temperatures follows the upper-air pattern: unseasonably cold in the Eastern U.S.
Based on the above reasoning and looking at analog years...
First, some highlights
*colder than “normal” winter
*snowier than normal winter
*coldest relative to normal: February
*snowiest: February (by far)
*2 major snowstorms in February
*a cold December with above normal snow
THE SPECIFICS-for Philadelphia
SNOW TEMPS
DEC. 7” -2.0 degrees
JAN 8” +1.0
FEB 16” -3.0
MAR 4” -1.0
TOTAL 30-40” (“Normal” is 22.4”)
As for other cities in our area, here are my estimated seasonal snow forecasts:
Allentown 50”
Downingtown 45”
Wilmington 32”
Atlantic City 28”
Millville 26”
Poconos 85”
Believe it or not, it’s possible I could be too conservative with this forecast-not enough snow or cold. But the patterns that look clear-cut now could change in the coming months. In any event, this should be a winter worth watching, which some will love and some will hate.