Either Major Or "Super" El Niño
El Niño has arrived in the Tropical Pacific. By now, you’ve probably heard that it’s a strong one, and could become the strongest ever recorded. The "BIG ONE" occurred in 1997-98, with other strong El Niños in 1982-83 and 1972-73.
Here’s the latest look at ocean temperatures in the Pacific compared to “normal:”
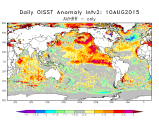
The reddish colors show the warmest changes compared to average. The El Niño is in the middle of the image, extending from the coast of South America all the way to near the Philippines (about 10,000 miles!). That’s a lot of warmth, which is helping to make 2015 the earth’s warmest on record.
But there’s more. Look at the two other HUGE warm areas north of the El Niño area. One is off the coast of Baja California -- the other off the Pacific Northwest and Alaska coasts. Let’s call them "Warm Pool Baja" and "Warm Pool Seattle." They may play an important role in our winter. More on that later. But back to El Niño...
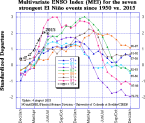
The image below compares the current El Niño to other strong El Niño years, just so you can see how extreme this one is (so far).
Strong El Niños & Winters Here
Local
Breaking news and the stories that matter to your neighborhood.


OK, so why should we care about ocean temperatures thousands of miles away? Because they affect our weather, that’s why. Strong El Niños have led to some very interesting winters here.
The El Niño of 1972-73 led to a winter with NO measurable snow in Philadelphia. Just some traces of snow. It was the least snowy winter ever recorded here. Did that get your attention? Maybe that was a coincidence. How about the other strong El Niño winters? The winter of 1997-98 was the strongest on record. And the snow: LESS THAN ONE INCH (0.8").
The other strong one was 1982-83. The snow: 35.9 inches. There, that spoils the theory of strong El Niños leading to nearly snowless winters here. Maybe.
But if we look a bit closer, we find that 21.3 inches of that snow fell in ONE STORM (Feb. 10-12). In fact, that was the biggest snowstorm on record, until the "Blizzard of '96" came around. So, what happened in that February that was different from the other strong El Niño months? The answer lies in the Arctic.
The Arctic Oscillation (AO)… The 'X' Factor
We have talked about the North Atlantic Oscillation (NAO) many times in the past. For the sake of simplicity, I’ll just say that when it’s "negative," we tend to get colder and snowier winter weather here. The AO hasn’t been talked about much in public until recent years. But it is also very important, and a "negative" AO also tends to lead to colder and snowier winters here (and the now notorious "Polar Vortex"). The correlation is very impressive, especially in recent years.
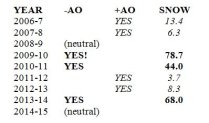
WOW! The average snow in -AO: 63.6 inches and in +AO: 7.9 inches.
It’s not a large "sample," but it is pretty amazing. The obvious conclusion is that if we can predict what the AO is going to be, we can predict whether we’ll have a very snowy or un-snowy winter. It seems like one extreme or another, unless the AO is near neutral. The problem is, just as with the NAO, we can’t predict the AO very far in advance.
What's the Connection of El Niño/AO?
The general theory is that El Niño helps flood much of the U.S. with warm air and moisture. It also associated with more frequent storms, such as Nor’easters. It’s like the atmosphere is on steroids. That’s what happened in 1972-73 and 1997-98, when we hardly had any snow. So, we get lots of storms, but it’s too warm for snow.
The best way to prevent it from being too warm for snow is to have a –AO, which is a blocking pattern that tends to prevent warm air from moving in. Instead of the blitzing linebacker (warm air) blasting straight through to the quarterback, we put in a really effective lineman (-AO). Now the quarterback can do what a quarterback does (snow in the winter), and it doesn’t matter how big and bad the linebacker is (can you tell I’m a football fan?). Like in February 1983, when an all-pro linebacker snuck in and crushed the quarterback during a period of –AO (biggest snowstorm on record!).
If you want to know more about the NAO and AO, here’s a good link.
Any Clues Regarding The AO?
A recent blog by Todd Crawford of WSI showed some interesting developments. The AO was negative practically all of July. He showed that the 10 "blockiest" July’s ALL were followed by –AO winters. This means that, if history repeats itself, another "big" winter is possible, despite the strong El Niño.
The Baja/Seattle Warm Pool:The 'Y' Factor
Look back at the graphic showing current ocean temperature anomalies. If the huge red area representing the El Niño is important, then the big “Baja & Seattle Warm Pools” should be, too. That’s a lot of extra warm water over thousands of miles. And it’s VERY close to the U.S. West Coast. It clearly has been related to the long California drought and extreme heat in the Pacific Northwest.
A part of that warm water pattern is called the PDO, and it was strong enough to have a big influence on last winter along the East Coast. While we started with little snow, a lot of late-season snow put us above average for the season. And remember Boston had their snowiest winter ever recorded. These "Baja & Seattle Warm Pools" could again become factors favoring more cold and snow in our part of the country.
August Summary
The current extreme ocean patterns in the Tropical and North Pacific are going to be major factors in what kind of winter we have. That is, if there are no big changes in them for the rest of the year. And the Arctic Oscillation will be another key. We’ve had a lot of "feast or famine" winters in the past decade, and early signs point to a potential one, too. It’s just too early to tell if it will be "feast" or "famine."
Stay tuned for monthly updates on this fascinating pattern.