"I'm shocked -- shocked! -- to find there's gambling going on here!"
That’s one of the many great lines in my all-time favorite movie, "Casablanca." It comes from Claude Rains, who plays corrupt Captain Renault as he closes the nightclub owned by Rick (Humphrey Bogart). As Renault says the line, Rick gives him his cut of the profits from the very gambling he just condemned. Of course Renault isn’t shocked-the gambling happens every day. Not only is he aware of it-he profits from it!
So, when I saw a tweet from the National Weather Service in Minneapolis on Wednesday, I thought of “Casablanca”:
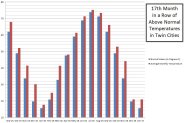
SEVENTEEN months in a row of above normal temperatures? I’m shocked, SHOCKED that this has happened. What are the odds on that happening? That’s like flipping a coin and getting heads seventeen times in a row! It just so happens I have the answer to that question: odds are 1 in 131,072. That’s .000763%. That also means that in a million years, this would happen about 8 times. So, unless the coin is “rigged,” any rational person has to realize that this is NOT a coincidence! The reason this is happening is that the climate of Minneapolis is getting warmer. Period.
WHAT ABOUT PHILADELPHIA?
In Philadelphia, we have now had above normal temperatures EIGHT months in a row. That’s not nearly as much as Minneapolis, but it still has odds of 1 in 256. The last month with below normal temperatures was May 2016, with a mere -0.9 degrees. Before that, we had TWELVE straight months of above normal temperatures (odds 1 in 4116, or a .02% chance).
Local
Breaking news and the stories that matter to your neighborhood.


Here are the numbers:
Jan. 2017 +5.5 degrees
Dec. 2016 +1.3
Nov. +2.4
Oct. +2.9
Sep. +4.4
Aug. +4.4
Jul. +3.1
Jun. +0.9
May -0.9
Apr. +0.5
Mar. +7.5
Feb. +2.9
Jan. +1.2
Dec. 2015 +13.7
Nov. +5.6
Oct. +1.0
Sep. +5.4
Aug. +2.4
Jul. +1.1
Jun. +1.5
May +6.2
The average month in that 21-month stretch has been 3.5 degrees above normal. That’s a lot. “Normal” is the average of each month between 1981-2010. What makes these stats even more impressive is that 1981-2010 is considered an unusually warm 30-year period to start with. Then go above that for 20 of 21 months. Remember, for Minneapolis, it is 17 straight.
We can’t be “shocked, SHOCKED, that a lot of places are much warmer than they used to be. This is what has been predicted for a couple of centuries. Increase carbon dioxide and other greenhouse gases and both the land and ocean will warm. And for the Arctic, that’s a real “no-brainer."
SPEAKING OF THE ARCTIC
Yikes! It’s hard to even imagine how fast and how extreme the area has changed. We’re talking about temperatures AND sea ice.
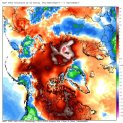
TEMPERATURE. Here’s a map of temperatures compared to normal for January 2017 in an area that stretches from Canada at the bottom to the North Pole in the middle, and Russia at the top. Temperature “anomalies” are incredibly high literally from the U.S./Canadian border to beyond the North Pole! That includes practically all of Canada and all of the Arctic. Some areas have been 30 to 50 degrees above normal. That’s not normal!
You might wonder: “who cares if it’s warm compared to normal in Canada and the Arctic in winter? Wouldn’t they like it to be less frigid?” And if ice in the Arctic Ocean melts, that won’t even raise sea level (like an ice cube melting in a glass doesn’t raise the water level).
THE ICE. Here’s the main problem: Ice reflects sunlight very well, which helps keep the earth cool. When ice is replaced by water, more sunlight is absorbed. That helps warm the earth, which helps melt more ice, which helps warm the earth, which helps melt…..you get the idea. This is called a “positive feedback”, and the great majority of climate scientists are plenty worried about it. This melting and warming is happening even faster than their computer models have been suggesting.
Here is the result of the recent extreme warmth. The extent that Arctic sea ice has dropped is at an incredible rate.
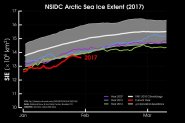
Here’s a quote from the guy who is Director of the organization responsible for the above graphic, the NSIDC (National Snow & Ice Data Center), Mark Serreze:
“After studying the Arctic and its climate for three and a half decades, I have concluded that what has happened over the last year goes beyond even the extreme.”
(By the way, the NSIDC is “supported by NASA, the National Science Foundation, NOAA, and other federal agencies”. Just a reminder about how involved the U.S. Government is in climate change research.)