
HAS IT REALLY BEEN 20 YEARS?
People have always wanted to get an idea what the coming winter will look like. Meteorologists had been unwilling to even make an educated guess, since there wasn’t any accepted science to help us. The public had to turn to the incredibly unreliable Old Farmer’s Almanac (proven to be worse than flipping a coin), or rely on myths like looking at acorns and wooly caterpillars.
It all changed in 1997, when we saw the Tropical Pacific warm up like never before. There had been some recent studies correlating strong El Niño’s with certain weather patterns the following winter. So I simply said: “Expect an unusually mild winter with very little snow.” And that’s what happened. Then people wanted a forecast every year, and with more and more detail as we learned more about factors influencing our winters.
HOW WAS THE FORECAST LAST YEAR?
Glad you asked. This has turned into something weird, in that some people only seem to care about the amount of seasonal snow predicted. But I’ve tried to tackle monthly temperatures and snow, along with expected highlights of the coming winter.
Here are some of the quotes from my forecast a year ago:
”Few days with snow”
Local
Breaking news and the stories that matter to your neighborhood.


”Most of our snow in only a couple of storms”
”Snow melts quickly”
”Record warmth”
Those things happened, although we got most of our snow from only ONE storm. That gave us 22.4” out of our seasonal total of 27.2”, which was above “normal”. I had predicted above normal snow: 30-38” total.
We ended up with our warmest December ever recorded, BY FAR. It was more than 13 degrees above normal-an incredible number! And we set record high temperatures on EIGHT separate days in December 2015.
WHAT’S DIFFERENT THIS YEAR? FIRST: THE PACIFIC
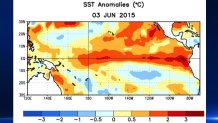
Last year, a near record El Nino was raging-very much like 1997. All that orange and red in the Tropical Pacific represented a WAAAY warmer than normal ocean (see below). Along with other factors, this helped lead to our very warm winter, few snow days, and one giant snowstorm.
Now, the Tropical Pacific looks dramatically different (see below). The blue area represents ocean temperatures below normal-called La Nina. It’s only classified as a “weak” La Nina at the moment.
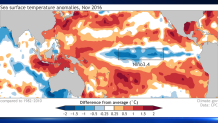
In a La Nina influenced winter, there tends to be fewer and weaker Nor’easters. That lowers the chances of huge snowstorms. Winters don’t tend to be extra warm, as they can with strong El Nino’s. So with this change alone, I expect more snow days and an overall colder winter than last year.
STRONG EL NINO TO A LA NINA: WHAT’S THE TENDENCY?
Next, we need to look back to other years that featured this rather rare combination of a strong El Nino evolving into a La Nina for the next winter. Our tax dollars help make that easy, courtesy of NOAA’s Earth System Research Lab.
Here are the weather maps for the “composite years” (or “analogs”):
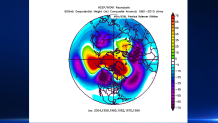
The best way to look at overall global weather patterns is to look high up in the atmosphere. Meteorologists focus on an area close to 20,000 ft. up (known as 500mb). Look at the composite pattern over North America. That purple area is waaay below normal pressures, and waaay above normal pressures are found in the upper right-over Greenland.
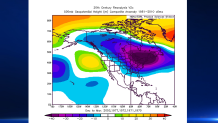
An experienced meteorologist can spend one second looking at this map before the eyebrows go up. That anomaly over Greenland represents a classic “negative NAO”, or –NAO (North Atlantic Oscillation). And the large region of high pressures over the Arctic represent a classic “negative AO” or –AO (Arctic Oscillation). Both the –AO and –NAO have often been connected to cold and snowy patterns around here.
While I don’t expect the whole winter to have a –AO pattern, that has been the trend throughout the fall. But so far, the super cold air has been on the other side of the world-near Siberia. There are suggestions that the coldest air will work its way around to Alaska and then to Canada and the Plains in the next month.
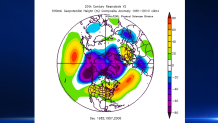
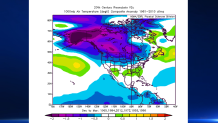
The map below shows what the analogs to the strong El Nino to La Nina patterns have been like: lots of cold in Alaska and Canada (where it happens to be unusually warm this month). This does NOT show super cold air dominating our part of the country, but suggests there will be enough cold air eventually to lead to several snow threats. Let’s see if that big shift happens this winter.
IT’S NOT ALL ABOUT THE PACIFIC
Of course, there are many other factors in play each year. A few trends over recent years may be leading to our snowier winters of late. In the past 8 years, we’ve had our two snowiest winters ever recorded, and 2 of the 3 biggest snowstorms ever recorded in Philadelphia. If the earth is warming, why would this happen?
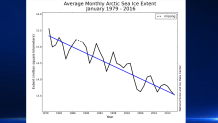
1. Ice is melting in Arctic at record levels. Some years are exceptions, but the trend is clearly down, as shown in a typical map below (this trend has happened in summer, too). Some have theorized that:
The increased melt leads to more open ocean
Which absorbs more heat than ice and warms the arctic
Which leads to more patterns of –AO
Which favor colder and snowier periods
2. More October snow has been falling on the other side of the world-especially in Eurasia. Studies have shown that years with more snow in October there are associated with snowier winters for us. Seven of the past 8 years have seen well above normal snow in Eurasia. This October was the snowiest of them all.
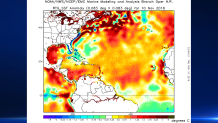
3. Warmer oceans off the East Coast in recent years have led to more moisture in the air. The water vapor has increased as a result. This allows any given storm to produce more precipitation. And when the air is cold enough for snow, it can mean more snowfall. Here are the current ocean anomalies in the Atlantic. That’s a lot of unusually warm water off our coast!
There are several more things I look at-things called the EPO, PDO, QBO, and AMO, but I’ve already gone on too long. Needless to say, I have factored them into the forecast.
First, some highlights
*overall colder and snowier
*no monster snowstorms (more than 15”)
*sharp change from warm Nov. to cold December
*January-snowiest month
*February-mildest month (compared to normal)
*Winter return in March
THE SPECIFICS- for Philadelphia
| SNOW | TEMPS | |
| DEC | 4" | -2 (below normal) |
| JAN | 14" | near normal |
| FEB | 8" | +2 |
| MAR | 6" | -2 |
| TOTAL | 28-36" | -2 |
As for other cities in our area, here are my estimated seasonal snow forecasts:
| Allentown | 44" (11" above normal) |
| Downingtown | 36" (8" above) |
| Wilmington | 26" (7" above) |
| Atlantic City | 17" (near normal) |
| Millville | 15" (2" above) |
| Poconos | 75" (6" above) |