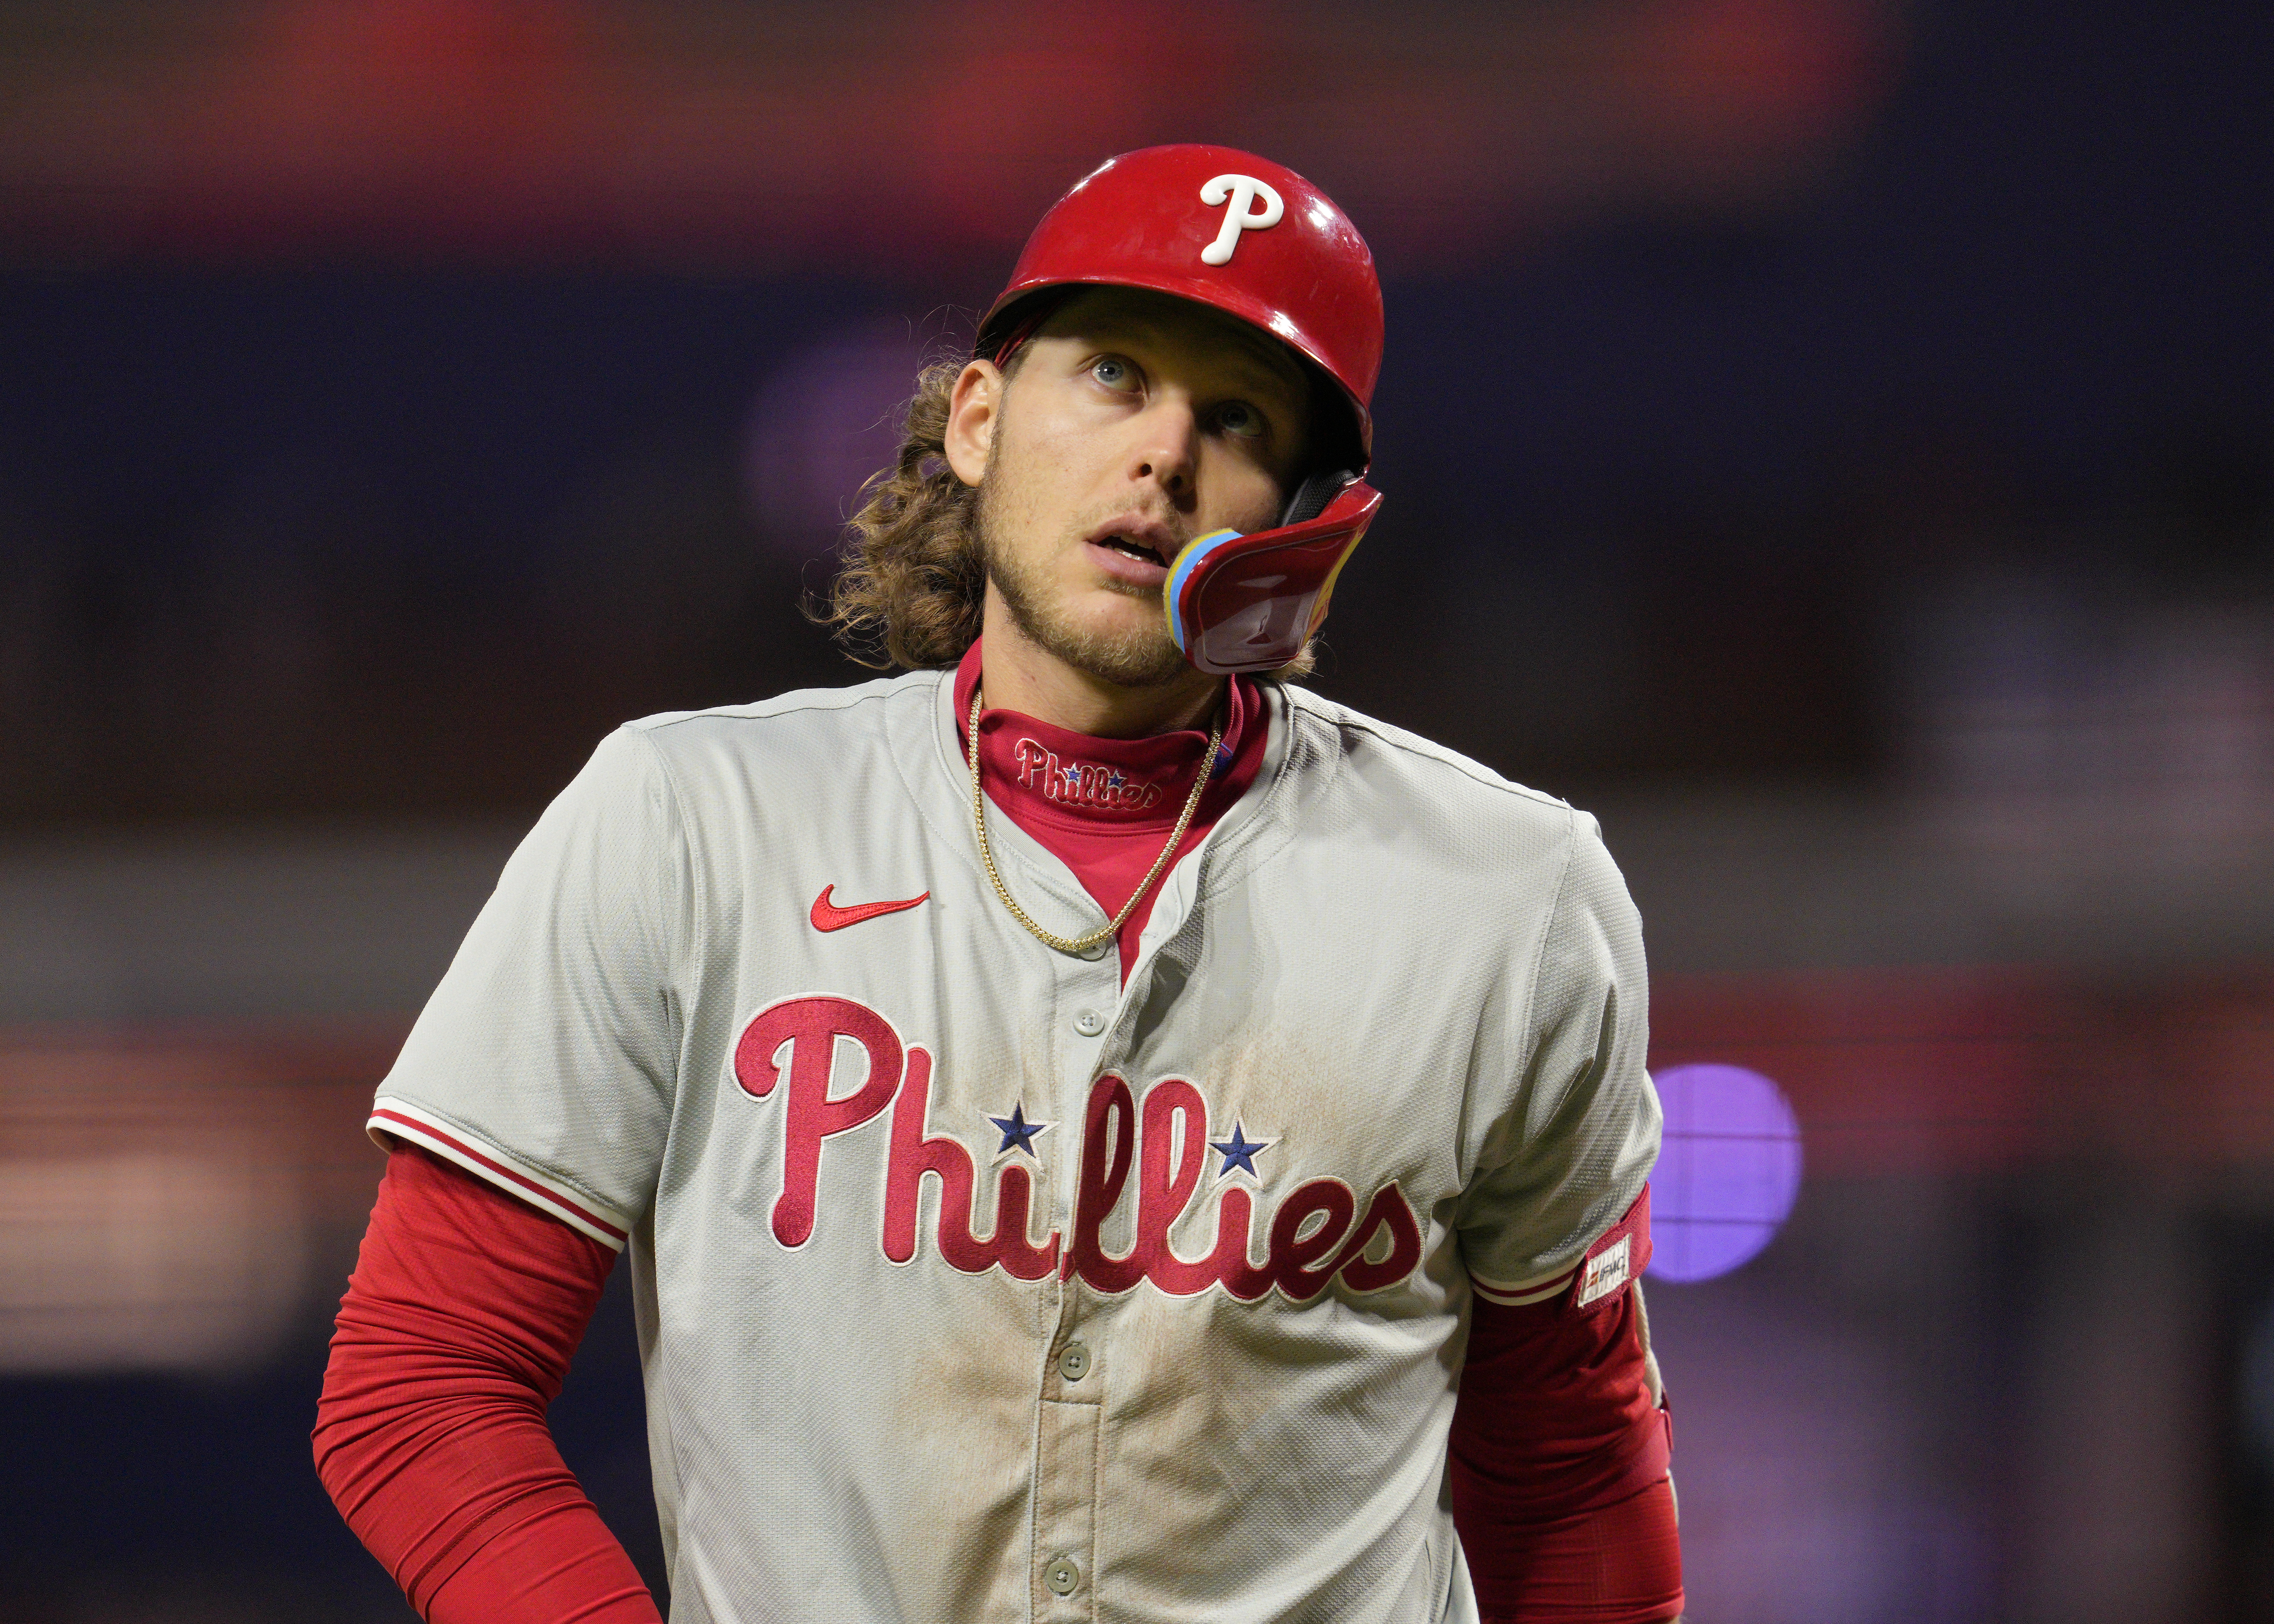
Some good, some bad in this edition of Phillies By the Numbers, 80 games into their season:
80 games in
At 35-45, the Phils are eight games better through 80 than they were last season.
A year ago at this point, they were 27-53, had scored 268 runs and allowed 399 for a run differential of minus-131.
This year, they've scored 278 runs and allowed 373 for a run differential of minus-95. Even though their early-season success was built off wins in one-run games, the Phils are still a better team than they were in 2015.
Herrera's OBP
Odubel Herrera was in the top-five in the majors in on-base percentage for much of the first two months but has dropped to 16th, at .393. Still, that's good for third among all MLB centerfielders, behind only Mike Trout (.422) and injured Dexter Fowler (.398).
Herrera's defense
Herrera has seven errors. No other major-league centerfielder has more than four. And truthfully, Herrera could have a few more if plays were scored differently in the moment.
Herrera's seven errors are as many as every NL West centerfielder has combined.
Philadelphia Phillies
Complete coverage of the Fightin' Phils and their MLB rivals from NBC Sports Philadelphia.
Lucky or good?
Herrera also has the third-highest batting average on balls in play (BABIP) in the majors since the start of last season at .375, behind only Xander Bogaerts (.377) and Paul Goldschmidt (.376).
You could say Herrera's lucky, but he also has 35 infield hits over that span, third-most in the NL behind Starling Marte and Dee Gordon. That'll keep the BABIP high.
Going the other way
Of Herrera's balls in play, 37.3 percent have been to the opposite field, the highest rate in the NL.
Franco YTD
Through 74 games, Maikel Franco is hitting .243/.302/.435 with 12 doubles, 13 home runs and 41 RBIs.
Through 74 games last season, Franco was hitting .278/.339/.483 with 21 doubles, 12 homers and 47 RBIs.
Franco has played essentially one full season since coming up in mid-May 2015. In 640 plate appearances, he's hit .262 with a .791 OPS, 34 doubles, 27 homers and 91 RBIs.
Walks and whiffs
As committed as the Phillies seem to be, top to bottom, in improving their players' plate selection, the major-league team still barely walks. The Phillies have walked in just 6.5 percent of their plate appearances, last in the NL and second-worst in baseball to the Royals. The Cubs lead the majors at 11.0 percent, but even below-average teams like the Brewers and Braves have out-walked the Phillies by 100 and 31, respectively.
The Phillies have also swung at the second-most pitches outside the strike zone, 31.7 percent, ahead of only the Braves.
And they've swung and missed at 11.3 percent of pitches, the highest rate in the NL.
Major-league pop-ups
Infield flies account for 10.5 percent of the Phillies' flyballs, the highest rate in the NL. Not good.
K/9 unit
The Phillies set the MLB record for the month of April with 10.2 strikeouts per nine innings.
They were middle of the pack, 15th, with 7.8 K/9 in May. They were 12th in June at 8.3.
Overall, Phillies pitchers rank seventh in the majors with 8.72 K/9, behind the Nationals, Dodgers, Yankees, Cubs, Marlins and Red Sox.
Uncle Charlie
It's no surprise that the Phillies — with Aaron Nola, Jerad Eickhoff and Vince Velasquez — have thrown the most curveballs of any pitching staff in baseball, 17.1 percent. The MLB average is right around 10 percent, and the Yankees rank last at 5.3 percent.
No NL team has thrown fewer sliders than the Phils' 9.2 percent.


