
Traditional liberal strongholds teamed up with the growing progressive class of greater Center City in Philadelphia’s primary election Tuesday to give Larry Krasner and Rebecca Rhynhart impressive victories in the races for district attorney and controller.
Twenty-nine of the top 30 divisions with the highest voter turnout are in Northwest Philadelphia, Center City, and West Philadelphia, according to data analyzed by NBC10.
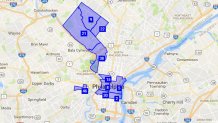
When compared to a map of results (courtesy of local mapmaker Wes Weaver) in the district attorney’s race, the high-turnout neighborhoods line up with those that voted for Krasner for district attorney. He is a defense attorney with no prosecutorial experience who is expected to upend the culture in the DA’s office.
The high-turnout locations also help explain how Rhynhart, a former city budget official, easily -- and surprisingly -- beat Alan Butkovitz, a three-term controller and longtime Democratic Party machine leader in the city.
Rhynhart, 42, was a favorite of the city’s rising progressive political class, with many calling Center City home.
The neighborhoods that favored her greatly out-voted those that have traditionally favored Butkovitz in the Northeast and South Philadelphia.
When it comes to turnout, the “power wards” of Northwest Philadelphia once again showed their strength. Numerous divisions in the Ninth, 21st and 22nd wards turned out at more than 35 percent, according to the data provided by the City Commissioners’ Office.
That compares to an overall city turnout of 17 percent. All the figures are preliminary until the commissioners certify the results, which will take place in the next three weeks.
Local
Breaking news and the stories that matter to your neighborhood.

In addition to the Northwest and the growing influence of downtown progressives (who live in the Second, Fifth, Eighth, 15th and 30th wards), one ward in West Philadelphia also proved consequential on Election Day.
The 46th ward covers much of the neighborhoods north of Baltimore Avenue from 45th to 58th streets as well as south of Baltimore and west of Clark Park.
The highest total votes cast for a single division in the city was 446 in the 46th ward’s 17th division, which encompasses the Cedar Park neighborhood. Turnout was 44 percent.
Ryan Godfrey, a polling place inspector for the division, marveled at the high number of voters on Election Day. The makeup of the neighborhood mirrors the results in the city’s two biggest races.
“This is a super activist community,” he said. “We’re in Cedar Park and there’s lots of people interested in politics and the local politics especially.”
He said his neighborhood doesn’t need a political machine apparatus to get out the vote.
With the end near for Butkovitz, who is symbolic of Philadelphia’s old guard, the entire city this week took a step in that direction.
Below is the list of the 30 divisions in Philadelphia by most votes cast in the 2017 primary election:
.tg {border-collapse:collapse;border-spacing:0;} .tg td{font-family:Arial, sans-serif;font-size:14px;padding:10px 5px;border-style:solid;border-width:1px;overflow:hidden;word-break:normal;} .tg th{font-family:Arial, sans-serif;font-size:14px;font-weight:normal;padding:10px 5px;border-style:solid;border-width:1px;overflow:hidden;word-break:normal;} .tg .tg-yw4l{vertical-align:top} th.tg-sort-header::-moz-selection { background:transparent; }th.tg-sort-header::selection { background:transparent; }th.tg-sort-header { cursor:pointer; }table th.tg-sort-header:after { content:''; float:right; margin-top:7px; border-width:0 4px 4px; border-style:solid; border-color:#404040 transparent; visibility:hidden; }table th.tg-sort-header:hover:after { visibility:visible; }table th.tg-sort-desc:after,table th.tg-sort-asc:after,table th.tg-sort-asc:hover:after { visibility:visible; opacity:0.4; }table th.tg-sort-desc:after { border-bottom:none; border-width:4px 4px 0; }@media screen and (max-width: 767px) {.tg {width: auto !important;}.tg col {width: auto !important;}.tg-wrap {overflow-x: auto;-webkit-overflow-scrolling: touch;}}
| Ward | Votes | Registered Voters | Turnout % |
|---|---|---|---|
| 46-17 | 446 | 1008 | 44.25% |
| 15-06 | 428 | 830 | 51.57% |
| 22-01 | 420 | 800 | 52.50% |
| 08-29 | 409 | 992 | 41.23% |
| 22-02 | 387 | 750 | 51.60% |
| 46-19 | 360 | 995 | 36.18% |
| 21-24 | 358 | 990 | 36.16% |
| 09-03 | 357 | 878 | 40.66% |
| 05-18 | 356 | 1250 | 28.48% |
| 30-07 | 356 | 1253 | 28.41% |
| 09-11 | 355 | 1034 | 34.33% |
| 09-09 | 353 | 887 | 39.80% |
| 02-16 | 344 | 913 | 37.68% |
| 05-01 | 342 | 1482 | 23.08% |
| 05-17 | 340 | 1628 | 20.88% |
| 46-16 | 339 | 831 | 40.79% |
| 05-19 | 339 | 1092 | 31.04% |
| 05-21 | 334 | 2265 | 14.75% |
| 46-01 | 333 | 800 | 41.63% |
| 09-12 | 333 | 841 | 39.60% |
| 09-13 | 330 | 680 | 48.53% |
| 65-20 | 326 | 1114 | 29.26% |
| 09-15 | 325 | 640 | 50.78% |
| 08-24 | 324 | 1471 | 22.03% |
| 05-04 | 307 | 1065 | 28.83% |
| 46-08 | 305 | 934 | 32.66% |
| 08-16 | 302 | 590 | 51.19% |
| 09-10 | 302 | 841 | 35.91% |
| 02-26 | 295 | 1184 | 24.92% |
| 22-06 | 292 | 893 | 32.70% |