
READ: Hurricane's Winter Forecast: How Much Snow?!
Occasionally, I will try to summarize some of the new, important, or especially interesting news in the field of Climate Change. This is one of those times.
THE BEST GRAPHICS YET!
There have probably been hundreds of different graphics used to illustrate climate change, and the role greenhouse gases like CO2 have on global temperatures. Many have been accurate, in my opinion, but some have been misleading, over-simplified, or confusing. It’s a very complex subject, and it’s hard to tell the whole story (or even most of the story) in a single graphic. But I finally saw one last week. It’s from www.bloomberg.com.
It takes multiple animations to come to the conclusion that is the basis for the general agreement among climate scientists worldwide. They’ve looked carefully at every potential factor influencing global temperatures. This isn’t just a couple of scientists doing a couple of studies. The animation is the result of dozens of research papers involving hundreds of climate scientists over many years, from “more than a dozen countries." This is the current state of the science.
There are a lot of things of note. For example, volcanoes and aerosols have had a negative influence on temperatures. If greenhouse gases hadn’t increased, global temperatures would have been going DOWN in recent decades. The only way to explain the actual temperature rise is by including greenhouse gases, such as CO2 (carbon dioxide). If this animation doesn’t convince you of the important role of CO2 in overall global warming, nothing will.
“NO SINGLE STORM CAN BE BLAMED ON CLIMATE CHANGE”-CAN’T SAY THAT ANY MORE
I used to say it all the time. So did climate scientists. Even those convinced of the overall impact of climate change were not willing to attribute individual storms to that phenomenon. Well, knowledge in science evolves, and we are now evolving into more and more evidence that those early statements weren’t totally true. Some weather disasters can apparently be attributed to climate change. There’s even a new branch of the science called “attribution science.”
Local
Breaking news and the stories that matter to your neighborhood.


Now, don’t get me wrong. There are people (generally politically motivated ones) who like to "blame" every extreme weather event on earth to climate change. A drought in the desert, a super typhoon hitting Japan, a heat wave in the Middle East, or a snowstorm in Boston can not necessarily be blamed, or even partially attributed to climate change. But that doesn’t mean the entire attribution science is “bunk." We have to look at it case by case.
And that is what some organizations are attempting. A recent report published in the Bulletin of the American Meteorological Society addressed 28 individual extreme events in 2014. There were 32 groups of scientists from around the world assigned to this massive task. There is no way to say with 100% certainty that 100% of an extreme event was due to climate change. But there are ways to calculate with increasing degrees of certainty that an event either wouldn’t have happened without climate change or would have been significantly less severe. This type of report has been done for a few years now, and more and more scientists have been taking these things seriously.
In the current report, events including droughts, heat waves, fires, floods, cold, snow, hurricanes, and even sea ice extent were studied. Here’s a map showing the locations.
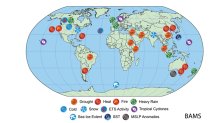
It turns out that about half of those events could be tied to climate change. For example, the wildfires in Northern California, hurricanes around Hawaii (which were even worse this year), drought in East Africa and part of Syria, record heat waves in Australia, Europe, China, and Argentina, and extreme rainfall in Southern France were found to be connected to climate change.
If that is all you heard in whatever media outlet you follow, you didn’t hear the whole story, though. The studies also found no apparent link to the extreme winter storms in North America or the United Kingdom, droughts in parts of Asia, the western Pacific active typhoon season, or the water shortage in Brazil.
In this evolving science, it’s important to be ‘fair” in reporting both sides of the attributions. Just reporting on one side or the other is simple bias, usually done for political reasons.
2015-HOTTEST YEAR ON EARTH-BY FAR
(yes, of course it was hotter when the earth was a molten mass-I’m talking about the past hundreds of years or more)
Global temperatures are calculated using different methods by different organizations and countries, but they are remarkably similar. One place might say 1998 was warmer than 2010, but the general idea is agreed on: the warmest years have all occurred in the past 20 years (most in the past 10 years-the record El Nino year of 1998 is the rare exception). The methods, which sometimes include “correcting” inaccurate numbers, may raise a stink in the non-climate-science world, but are an accepted part of calculations of the past. There is no conspiracy among hundreds of scientists to “cook the books," giving results that aren’t real. Has there ever been a conspiracy so large and widespread? How could such a thing stay a secret? The idea is simply laughed at by most climate scientists. For the others: it just gets them mad.
So, with that preface, here is one simple illustration of just how warm 2015 is compared to all the other warm years in the recent past. It’s not even close. You might say: “Well, the scale is tiny-only 0.6 degrees Fahrenheit”. Yes it is. But tenths of a degree are important when talking about global temperatures.
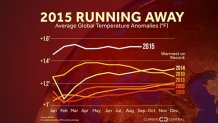
The near-record El Nino this year is clearly the main factor in this temperature “spike”. But 2015 is going to end up much warmer than the other record El Nino of 1998. El Nino’s are simply warmer than they used to be. And La Nina’s are also warmer than they used to be.